Interface Overview
Complete guide to the Raman Spectroscopy Analysis Application user interface.
Table of Contents
Main Window Layout
The application uses a modern tabbed interface with consistent organization across all pages.
Window Structure
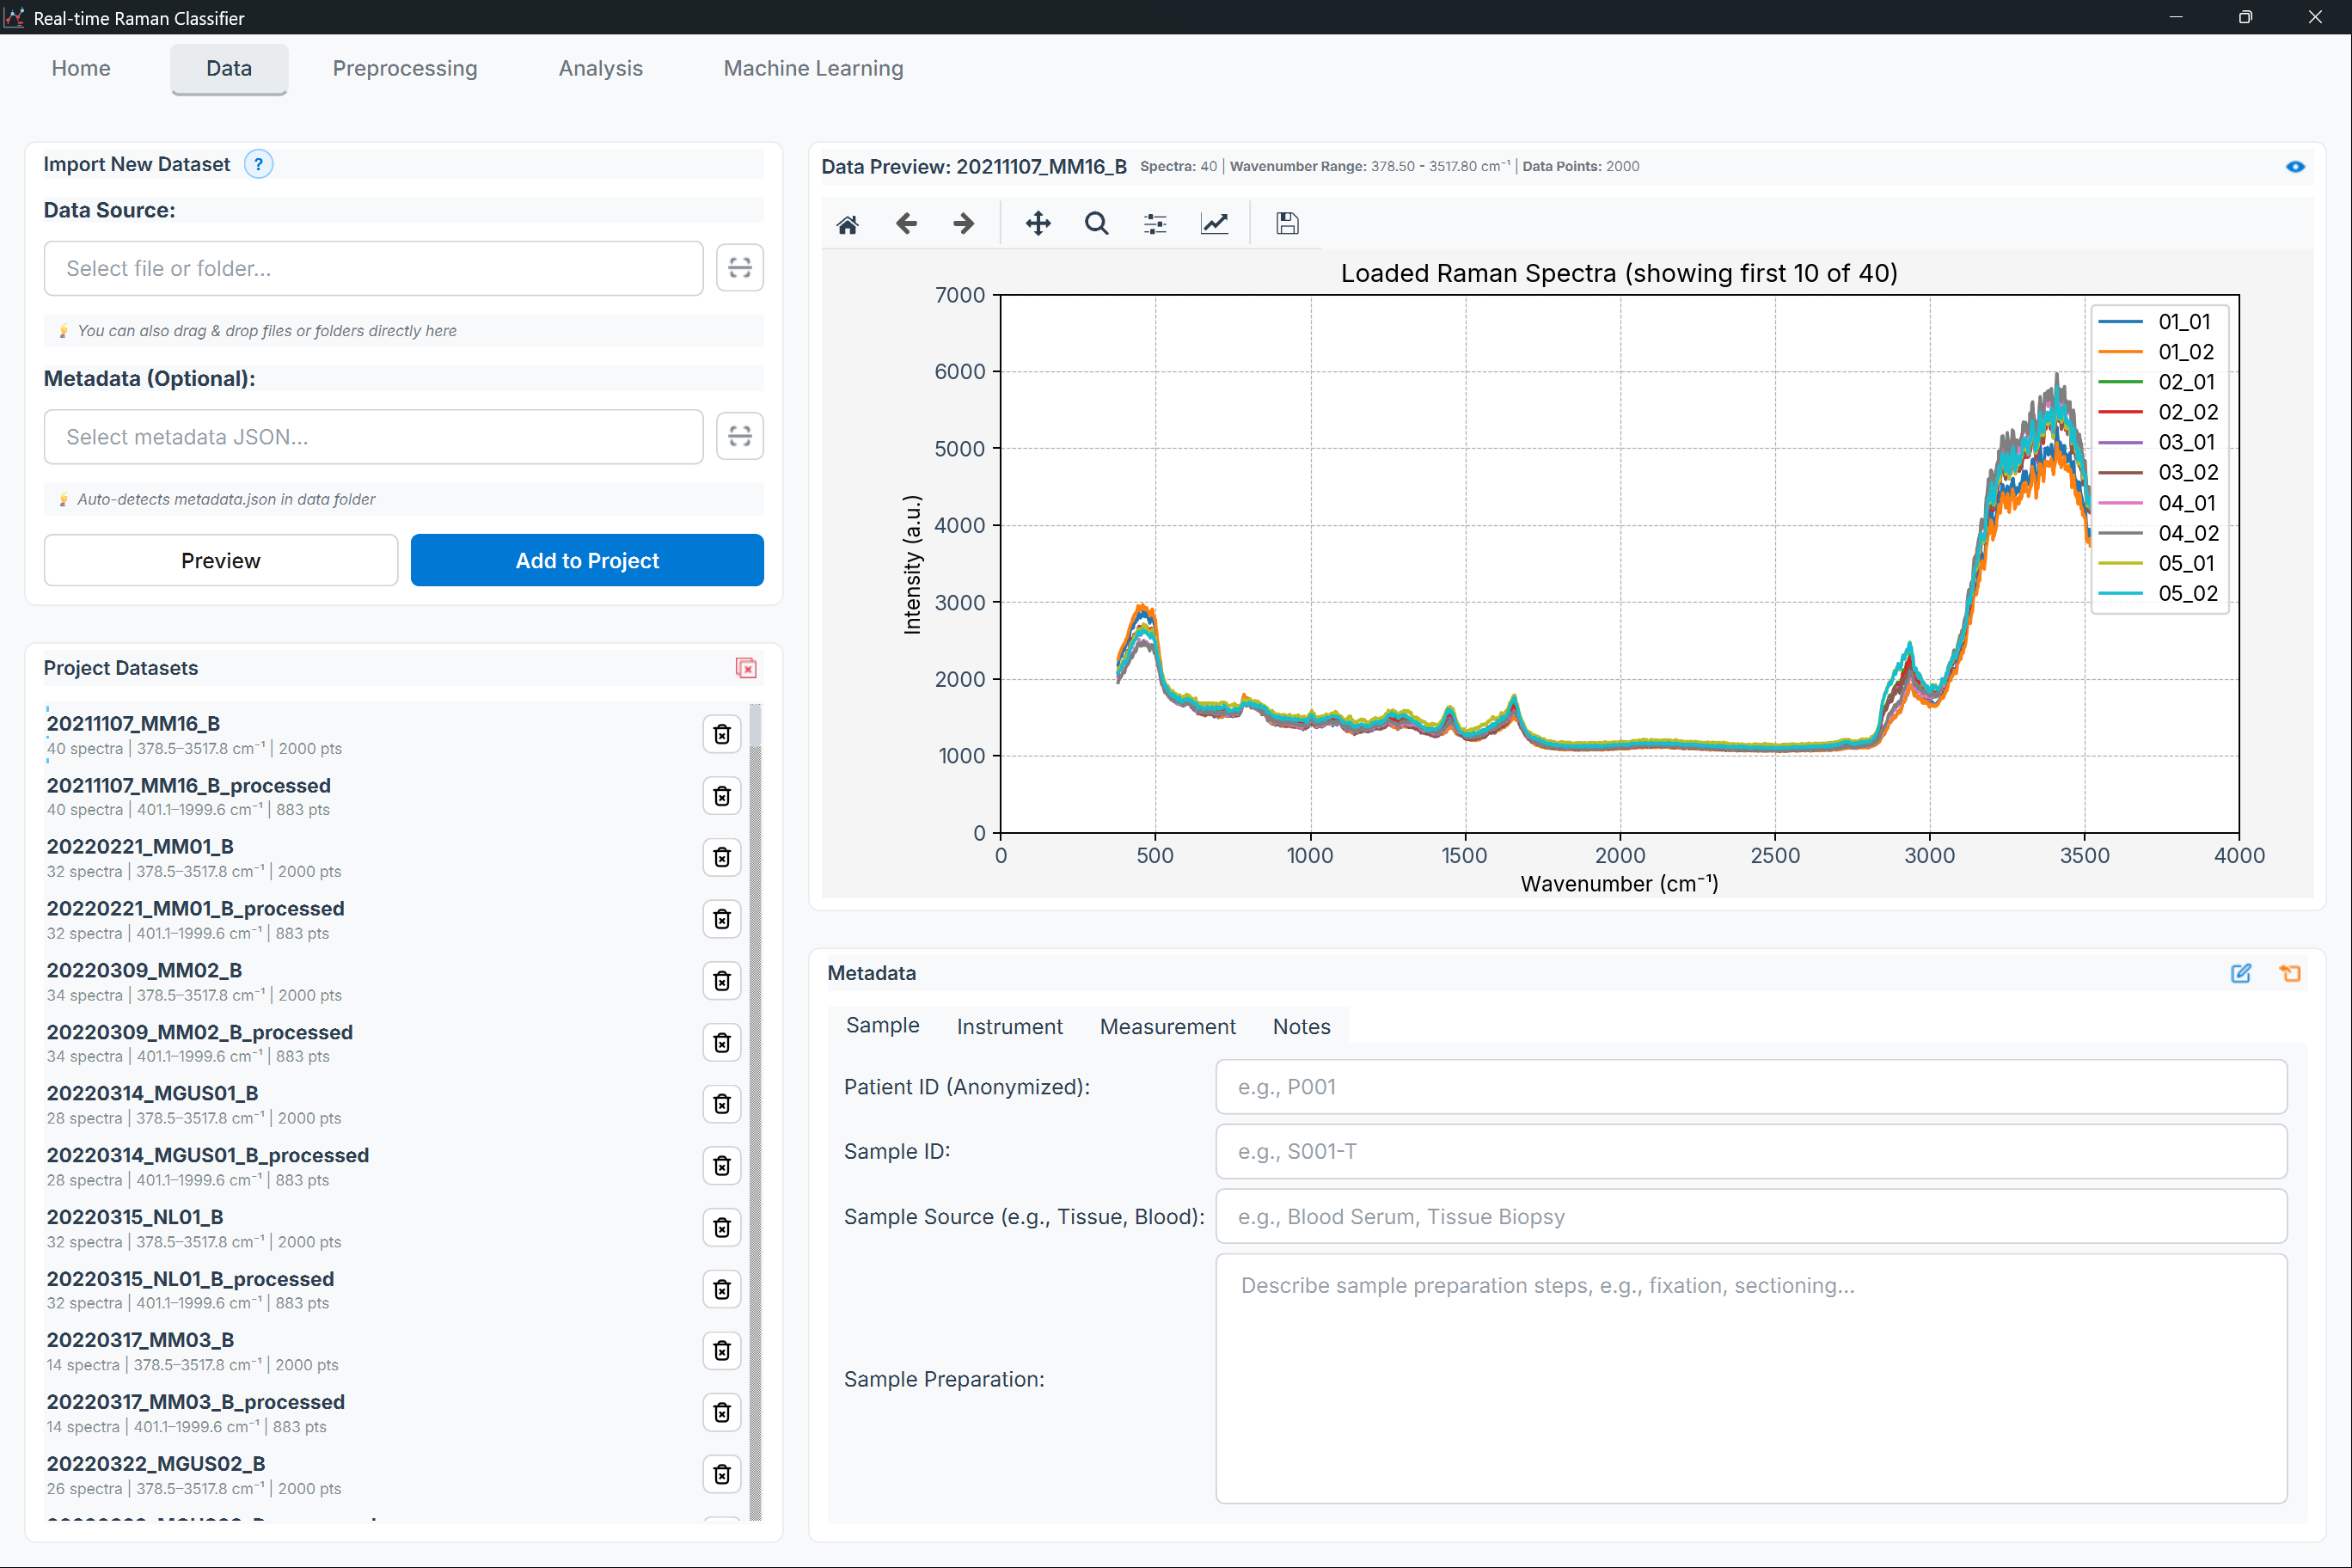
Figure: Main application window showing title bar, menu bar, tab navigation, and status bar
Key Components
Title Bar
Application name
Standard window controls (minimize, maximize, close)
Menu Bar
File operations (New, Open, Save, Export)
Edit functions (Undo, Redo, Copy, Paste)
View options (Theme, Zoom, Layout)
Tools (Calibration, Batch Processing)
Settings (Preferences, Configurations)
Help (Documentation, About)
Language & Theme Switcher
[EN/JA]: Toggle between English and Japanese
🌙/☀️: Toggle between dark and light themes
Tab Navigation
🏠 Home: Project overview and recent activity
📦 Data Package: Data import and management
🔧 Preprocess: Preprocessing pipeline builder
📊 Analysis: Exploratory and statistical analysis
🤖 ML: Machine learning workflows
💼 Workspace: Project and file management
Main Content Area
Dynamic content based on selected tab
Responsive layout adjusts to window size
Split-view support for data/results
Status Bar
Current operation status
Active project name
System resource usage (CPU, memory)
Progress indicators for long operations
Navigation System
Tab-Based Navigation
The application uses page-based architecture where each major function has its own dedicated tab.
Home Page
Purpose: Project dashboard and quick actions
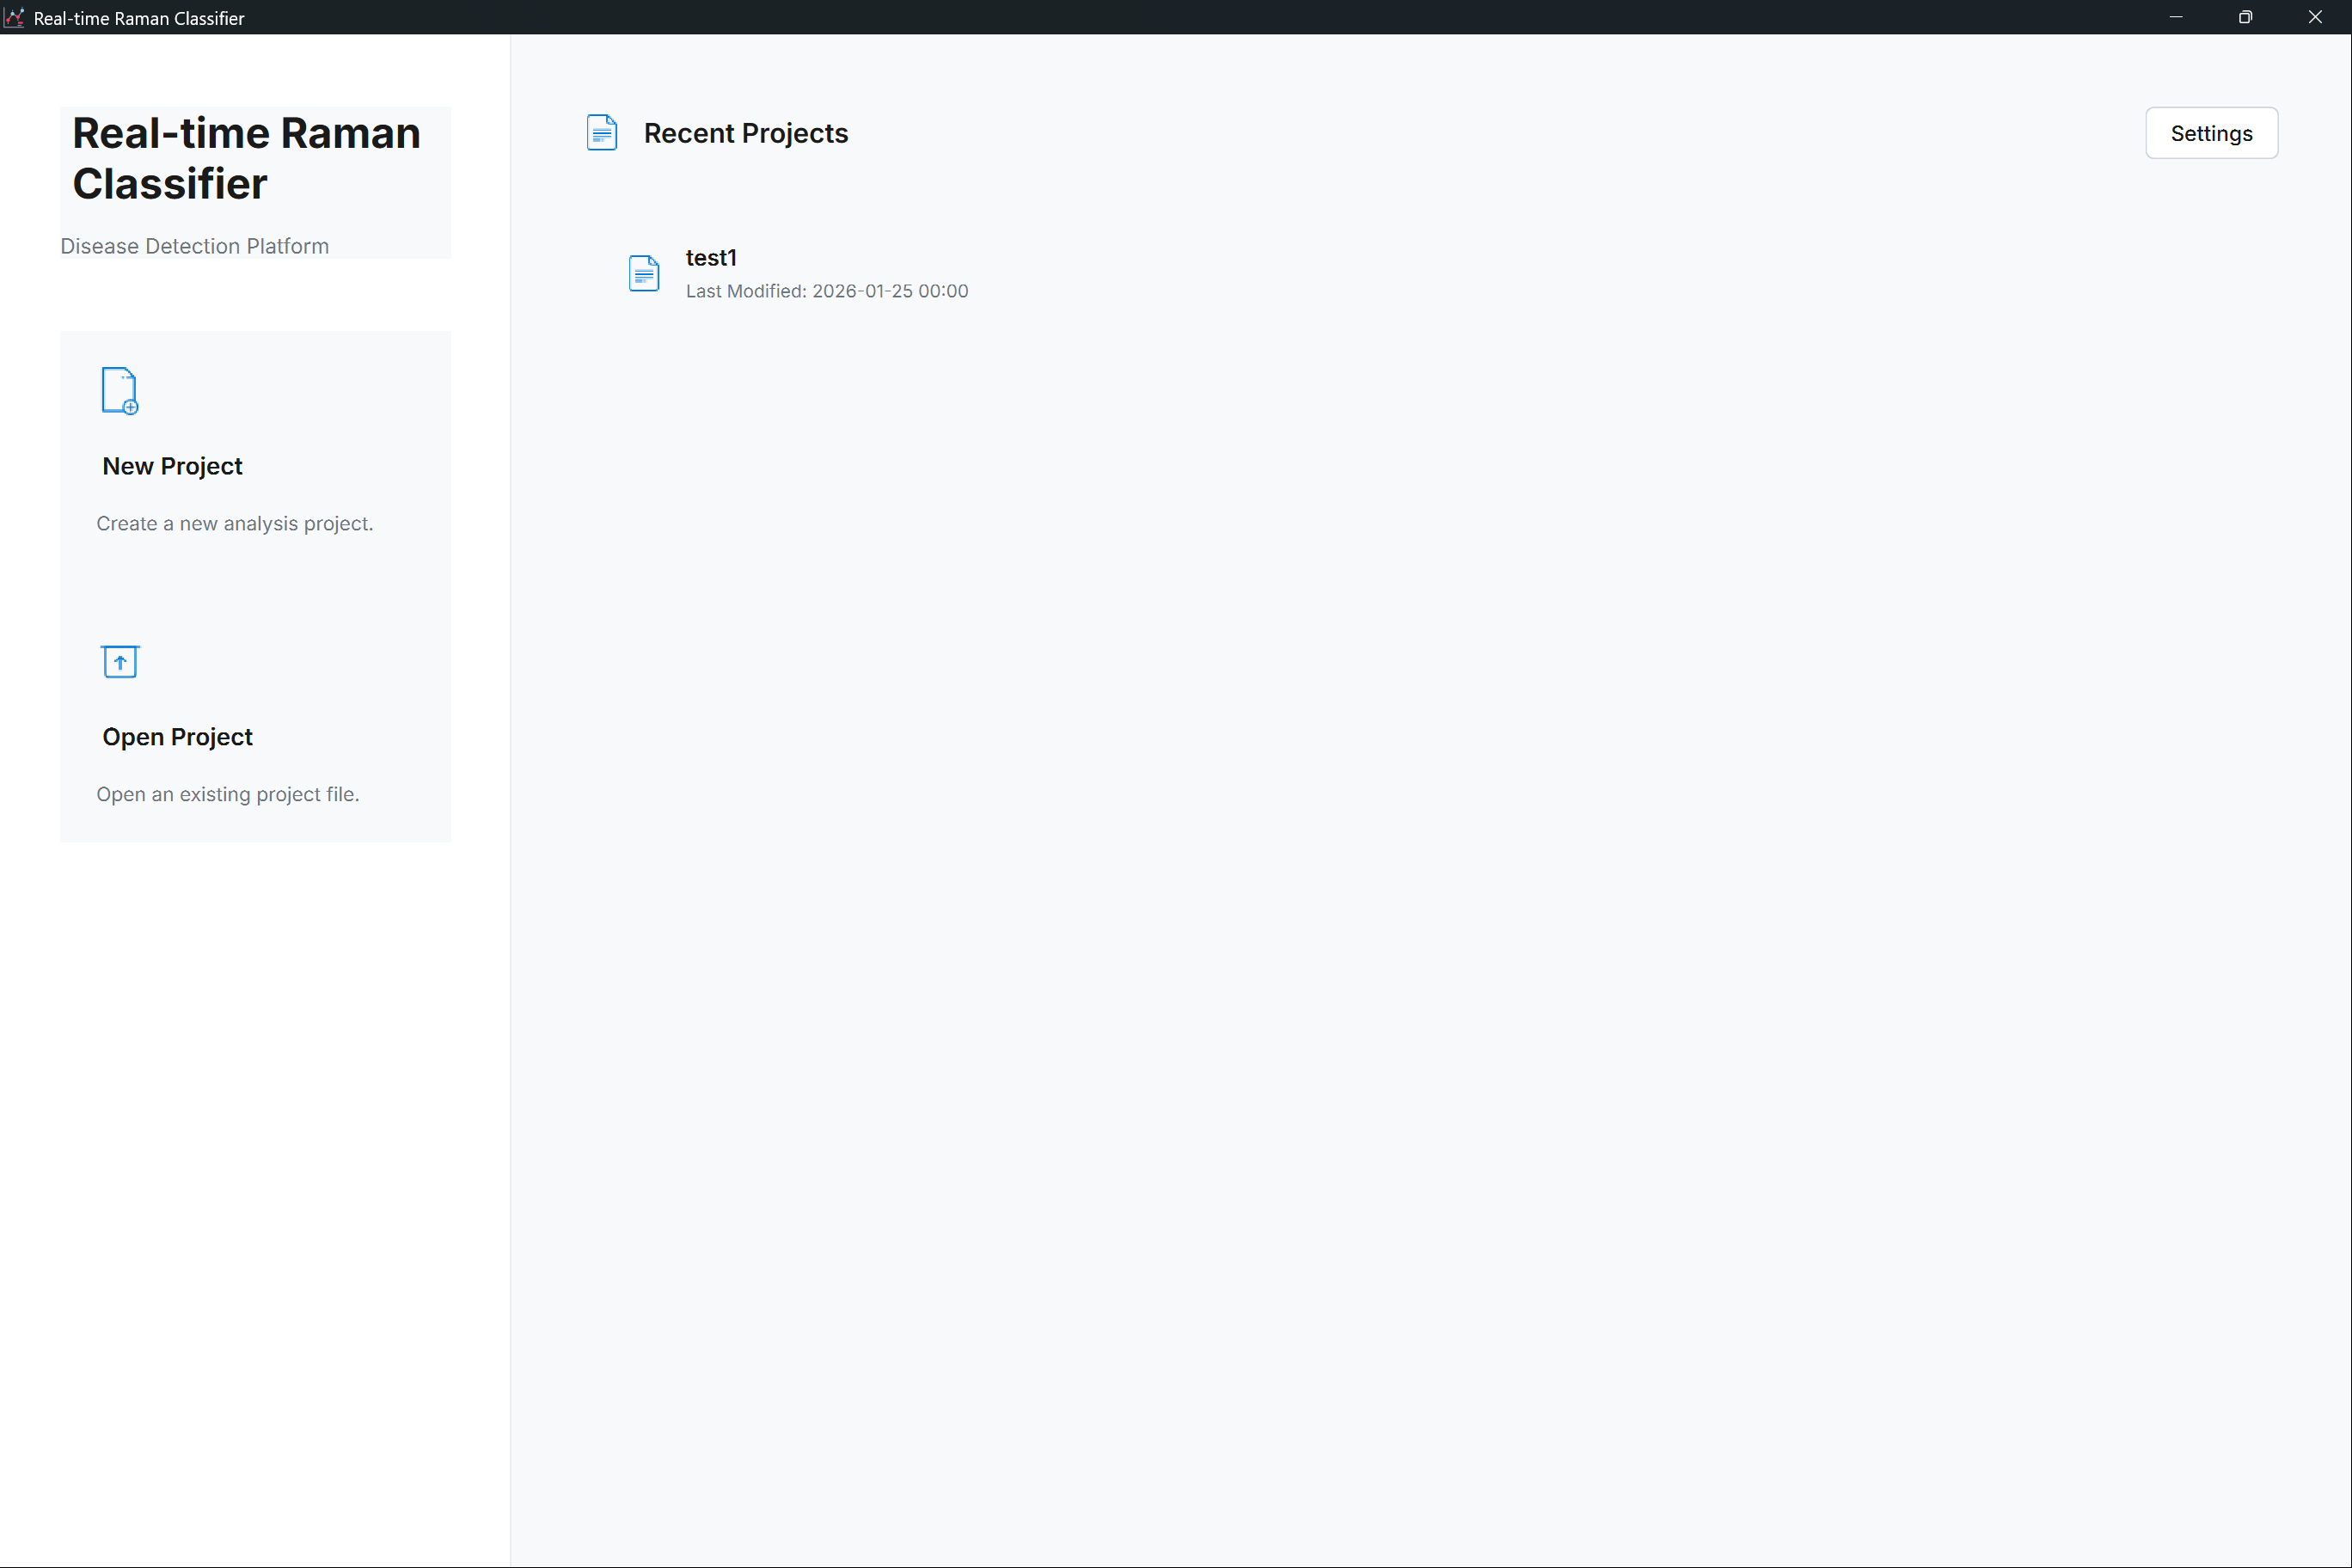
Figure: Home page showing recent projects, quick actions, and system status
Recent projects list
Quick start tutorials
System status overview
News and updates
Common Actions:
Create new project
Open existing project
Access templates
View documentation
Data Package Page
Purpose: Data import, organization, and management
Figure: Data Package page with file browser, dataset list, and preview panel
File browser for CSV/TXT import
Data validation and preview
Group assignment for samples
Metadata editor
Common Actions:
Import spectral data
Create sample groups
Edit wavenumber calibration
Export data packages
Preprocess Page
Purpose: Build and apply preprocessing pipelines
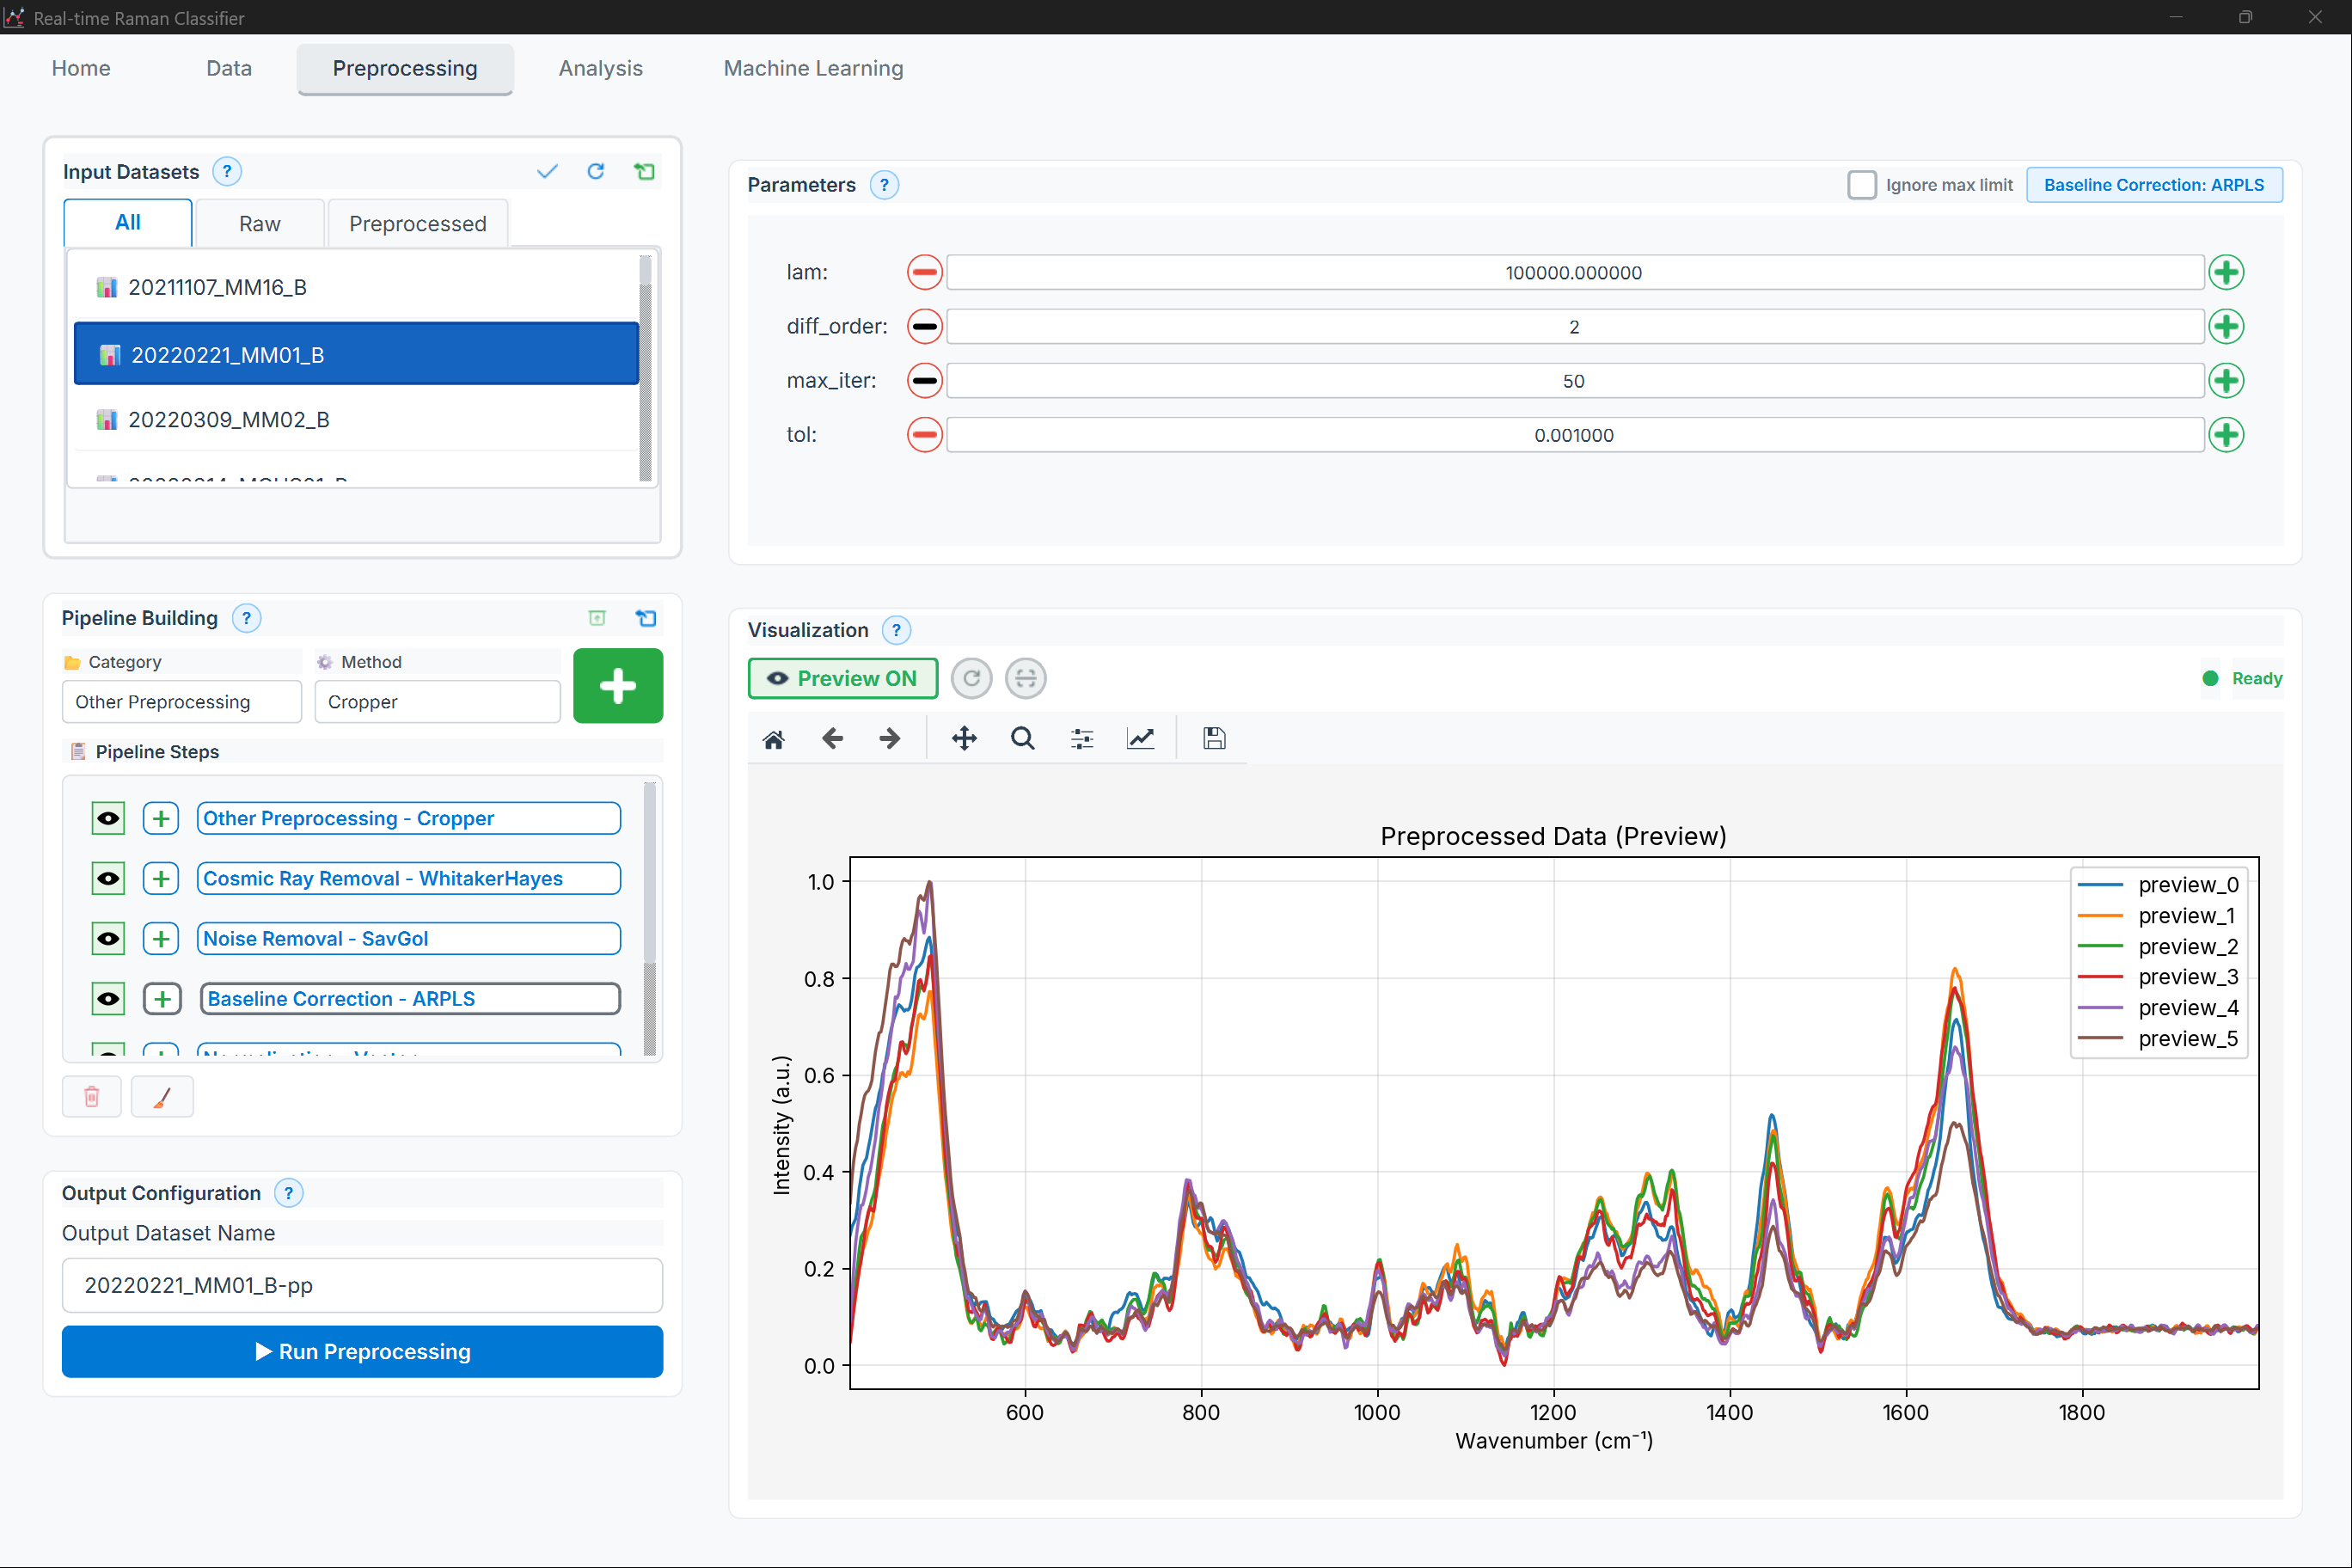
Figure: Preprocessing page showing method selector, parameter panel, pipeline builder, and preview plot
Method selector panel (40+ methods)
Parameter configuration
Real-time preview
Pipeline save/load
Common Actions:
Add preprocessing steps
Adjust parameters
Preview effects
Apply to dataset
Save pipeline for reuse
Exploratory Analysis Page
Purpose: Exploratory and statistical analysis

Figure: Analysis page with method categories, dataset selector, and interactive plot viewer
Method category tabs (Exploratory, Statistical, Visualization)
Interactive plot viewers
Results export
Batch analysis support
Common Actions:
Run PCA/UMAP/t-SNE
Perform statistical tests
Generate visualizations
Export figures and data
Modeling & Classification Page
Purpose: Train, validate, and deploy ML models

Figure: Machine Learning page showing algorithm selector, hyperparameter tuning panel, and evaluation dashboard
Algorithm selection panel
Hyperparameter tuning
Cross-validation setup
Model evaluation dashboard
Common Actions:
Select ML algorithm
Configure validation strategy
Train models
Evaluate performance
Export trained models
Workspace Page
Purpose: Project and file management
Project directory tree
File operations
Settings and preferences
Backup management
Common Actions:
Browse project files
Manage backups
Configure settings
Clean temporary files
Common UI Elements
Panels and Widgets
Data Selector Panel
Located on the left side of most pages for selecting input data.
Layout: Vertical panel with checkboxes for each dataset, plus “Select All” and “Clear” buttons at the bottom.
Visual Reference: See the Data Package Page screenshot for the actual appearance of this component.
Features:
Multi-selection with checkboxes
Search/filter functionality
Select all / Clear all buttons
Drag-and-drop support
Parameter Panel
Standard interface for method configuration.
Layout: Vertical panel with labeled parameters (Window Size, Polynomial Order, Derivative Order, etc.), each with appropriate input widgets (dropdowns, sliders, spinboxes). Action buttons (Reset, Apply, Add to Pipeline) are placed at the bottom.
Visual Reference: See the Preprocessing Page screenshot for the actual parameter panel appearance.
Features:
Dropdown menus for discrete choices
Sliders for continuous ranges
Spin boxes for numeric input
Tooltips on hover (hover over label)
Real-time validation
Reset to defaults button
Results Panel
Standard layout for displaying analysis results.
Layout: Panel with “Results” header and action buttons (Copy 📋, Export Plot 📊, Save Data 💾) in the top-right. Main area shows plots or tables. Summary statistics are displayed below the main result.
Visual Reference: See the Analysis Page and ML Page screenshots for actual results panel appearances.
Features:
📋: Copy results to clipboard
📊: Export plot as image (PNG, SVG)
💾: Save data table (CSV, XLSX, JSON, TXT, PKL)
Summary statistics below main result
Zoom, pan, and interact with plots
Toast Notifications
Non-intrusive notifications for user feedback.
Appearance: Small popup notification in the bottom-right corner of the window, showing an icon (✓, ℹ️, ⚠️, or ✗) followed by a brief message and optional details. Auto-dismisses after 3-5 seconds.
Types:
Success (✓ green): Operation completed
Info (ℹ️ blue): Informational message
Warning (⚠️ yellow): Potential issue
Error (✗ red): Operation failed
Dialog Windows
Multi-Group Selection Dialog
Used for assigning samples to multiple groups.
Layout: Modal dialog with “Assign Samples to Groups” title. Checkboxes list available groups. Management buttons (+ New Group, Edit, Delete) below the list. Standard Cancel/OK buttons at the bottom.
Visual Reference: See the Data Package Page screenshot showing group management dialogs.
External Evaluation Dialog
For uploading test sets for model evaluation.
Layout: Modal dialog with “External Test Set Evaluation” title. Three file selection rows: Test Data File (required), Labels File (optional), and Model File (required). Each row has a “Browse…” button and displays the selected filename. Cancel and Evaluate buttons at the bottom.
Visual Reference: See the Machine Learning Page screenshot showing evaluation dialogs.
Customization
Theme Selection
Light Theme (Default for well-lit environments):
White background
Dark text
Blue accents
High contrast for readability
Dark Theme (Recommended for extended use):
Dark gray/black background
Light text
Cyan/green accents
Reduced eye strain
How to switch:
Click 🌙/☀️ icon in top-right corner
Or:
Settings → Appearance → ThemeChanges apply immediately (no restart needed)
Language Selection
English (EN) - Default interface language
Japanese (JA) - Complete Japanese translation
How to switch:
Click [EN/JA] button in top-right corner
Or:
Settings → Language → Interface LanguageRestart application for full effect
Note: Plot labels and some technical terms remain in English for scientific consistency.
Layout Customization
Split-View Mode
Display data and results side-by-side:
Figure: Split-view layout (data on left, results on right)
Enable: View → Layout → Split View or Ctrl + Shift + 2
Compact Mode
Reduce padding and margins for smaller screens:
Enable: View → Layout → Compact Mode
Font Settings
Adjust text size for better readability:
Go to
Settings → Appearance → FontOptions:
UI Font Size: 8pt - 16pt (default: 10pt)
Code Font: Monospace fonts for technical views
Plot Font: Font for chart labels (8pt - 14pt)
Panel Visibility
Show/hide specific panels:
View → Panels → Data Selector(toggle left panel)View → Panels → Parameters(toggle right panel)View → Panels → Status Bar(toggle bottom bar)
Default Directories
Configure default locations:
Settings → PathsSet:
Projects Directory: Default location for new projects
Data Import Directory: Default for file browser
Export Directory: Default for saved results
Pipeline Library: Location for saved pipelines
Workflow Integration
Typical User Workflow
        graph LR
    A[Home] --> B[Data Package]
    B --> C[Preprocess]
    C --> D[Analysis]
    D --> E{Need ML?}
    E -->|Yes| F[ML]
    E -->|No| G[Export]
    F --> G
    G --> H[Workspace]
Start at Home: Create or open project
Import Data: Use Data Package page to load spectra
Preprocess: Build preprocessing pipeline
Analyze: Run exploratory or statistical analysis
ML (Optional): Train classification/regression models
Export: Save results and trained models
Manage: Use Workspace for file organization
Context Preservation
The application remembers your state:
Last opened project
Recent file selections
Tab positions
Panel visibility
Theme and language preferences
Window size and position
Data persists between sessions automatically.
Accessibility Features
High Contrast Mode
For users with visual impairments:
Enable: Settings → Accessibility → High Contrast
Features:
Increased contrast ratios (7:1 minimum)
Thicker borders and outlines
Larger click targets
Distinguishable focus indicators
Screen Reader Support
Compatible with:
NVDA (Windows)
JAWS (Windows)
VoiceOver (macOS)
Enable: Settings → Accessibility → Screen Reader Mode
Tips and Best Practices
Performance Optimization
For large datasets (>1000 spectra):
Enable “Compact Mode” to reduce memory usage
Close unused tabs
Disable real-time preview during preprocessing
Use batch processing for multiple operations
Multi-Monitor Setup
Optimizing for dual displays:
Drag main window to primary monitor
Open plot windows on secondary monitor
Use
View → Detach Plotsto create floating windowsArrange for optimal comparison
Quick Actions
Speed up common tasks:
Right-click on datasets for context menu
Use middle-click to open in new window
Double-click on results to expand
Drag-and-drop files directly into import area
Troubleshooting UI Issues
Interface Not Responding
Symptoms: UI freezes, buttons don’t respond
Solutions:
Wait for current operation to complete (check status bar)
Press
Ctrl + .to stop operationIf frozen >30s, check Task Manager for CPU usage
Force close and restart if necessary
Missing Panels
Symptoms: Panels disappeared or not visible
Solutions:
Check
View → Panelsmenu to re-enableReset layout:
View → Layout → Reset to DefaultCheck window size (panels hide on small screens)
Font Rendering Issues
Symptoms: Text appears blurry or incorrect
Solutions:
Update graphics drivers
Disable display scaling:
Settings → Appearance → Disable ScalingChange font:
Settings → Appearance → Font → System Default
Theme Not Applying
Symptoms: Theme changes don’t take effect
Solutions:
Restart application
Reset theme:
Settings → Appearance → Reset ThemeDelete config file:
C:\Users\<username>\.raman_app\ui_config.json
See Also
Data Import Guide - Detailed data management
Settings and Preferences - Configuration options
Accessibility Documentation - Accessibility features
Next: Data Import Guide →