Components API
Reference documentation for UI components and widgets.
Table of Contents
Component Architecture
Component Hierarchy
MainApplication
├── AppTabs (Tab Container)
│   ├── HomePage
│   ├── DataPackagePage
│   ├── PreprocessPage
│   ├── AnalysisPage
│   ├── MachineLearningPage
│   └── WorkspacePage
├── Toast (Notifications)
├── StatusBar
└── Dialogs
    ├── MultiGroupDialog
    ├── ExternalEvaluationDialog
    └── ParameterDialog
App Tabs
components/app_tabs.py
Tabbed navigation container for application pages.
AppTabs Class
from components.app_tabs import AppTabs

tabs = AppTabs(parent)
Features:
Page management
Tab switching
State preservation
Page lifecycle
Attributes:
tabs.pages          # Dict[str, QWidget]: Page instances
tabs.current_page   # QWidget: Active page
tabs.tab_widget     # QTabWidget: Qt tab widget
Methods:
add_page(name: str, page: QWidget, icon: QIcon = None)
Add page to tabs.
from pages.home_page import HomePage

home = HomePage()
tabs.add_page(
    name='Home',
    page=home,
    icon=QIcon('icons/home.png')
)
Parameters:
name(str): Tab labelpage(QWidget): Page widgeticon(QIcon, optional): Tab icon
Returns: int - Tab index
remove_page(name: str)
Remove page from tabs.
tabs.remove_page('Home')
Parameters:
name(str): Page name
switch_to_page(name: str)
Switch to specific page.
tabs.switch_to_page('Preprocessing')
Parameters:
name(str): Page name
Side Effects: Calls on_page_show() if page implements it
get_page(name: str) -> QWidget
Get page instance.
preprocess_page = tabs.get_page('Preprocessing')
Parameters:
name(str): Page name
Returns: QWidget or None
get_current_page() -> QWidget
Get currently active page.
current = tabs.get_current_page()
print(f"Current page: {current.__class__.__name__}")
Returns: QWidget - Active page
Signals:
# Emitted when tab changes
tabs.page_changed.connect(lambda name: print(f"Switched to {name}"))

# Emitted before page close
tabs.page_closing.connect(lambda name: save_page_state(name))
Page Registry
components/page_registry.py
Dynamic page registration and discovery system.
PageRegistry Class
from components.page_registry import PageRegistry

registry = PageRegistry.get_instance()
Singleton Pattern: Only one registry instance exists
Methods:
register_page(page_id: str, page_class: type, metadata: dict = None)
Register page class.
from pages.custom_page import CustomPage

PageRegistry.get_instance().register_page(
    page_id='custom_analysis',
    page_class=CustomPage,
    metadata={
        'title': 'Custom Analysis',
        'category': 'Analysis',
        'icon': 'icons/custom.png',
        'order': 100
    }
)
Parameters:
page_id(str): Unique page identifierpage_class(type): Page class (not instance)metadata(dict, optional): Page metadata
Metadata Fields:
title(str): Display titlecategory(str): Category for groupingicon(str): Icon pathorder(int): Display order (lower = earlier)requires(list): Required dependencies
unregister_page(page_id: str)
Unregister page.
registry.unregister_page('custom_analysis')
Parameters:
page_id(str): Page identifier
get_page_class(page_id: str) -> type
Get registered page class.
PageClass = registry.get_page_class('preprocessing')
page_instance = PageClass()
Parameters:
page_id(str): Page identifier
Returns: type - Page class
get_all_pages() -> Dict[str, dict]
Get all registered pages.
pages = registry.get_all_pages()

# Returns:
# {
#     'home': {'class': HomePage, 'metadata': {...}},
#     'preprocessing': {'class': PreprocessPage, 'metadata': {...}},
#     ...
# }
Returns: Dict[str, dict] - Page registry
get_pages_by_category(category: str) -> List[str]
Get pages in category.
analysis_pages = registry.get_pages_by_category('Analysis')
# Returns: ['exploratory', 'statistical', 'machine_learning']
Parameters:
category(str): Category name
Returns: List[str] - Page IDs
Toast Notifications
components/toast.py
Non-intrusive notification system.
Toast Class
from components.toast import Toast

# Show success message
Toast.success("Data imported successfully", parent=self)

# Show error message
Toast.error("Failed to load file", parent=self)

# Show info message
Toast.info("Processing started", parent=self)

# Show warning message
Toast.warning("Large file may take time", parent=self)
Static Methods:
success(message: str, parent: QWidget = None, duration: int = 3000)
Show success toast.
Toast.success(
    "Model trained successfully",
    parent=self,
    duration=5000  # 5 seconds
)
Parameters:
message(str): Message textparent(QWidget, optional): Parent widgetduration(int): Display duration in milliseconds
error(message: str, parent: QWidget = None, duration: int = 5000)
Show error toast.
Toast.error(
    "Invalid data format",
    parent=self,
    duration=5000
)
Parameters: Same as success()
info(message: str, parent: QWidget = None, duration: int = 3000)
Show info toast.
Toast.info(
    "Loading data...",
    parent=self,
    duration=2000
)
Parameters: Same as success()
warning(message: str, parent: QWidget = None, duration: int = 4000)
Show warning toast.
Toast.warning(
    "Large dataset detected",
    parent=self,
    duration=4000
)
Parameters: Same as success()
Customization:
# Custom toast
toast = Toast(
    message="Custom notification",
    toast_type='info',
    parent=self
)
toast.set_position('top-right')  # 'top-left', 'top-right', 'bottom-left', 'bottom-right'
toast.set_style({
    'background': '#2196F3',
    'color': '#FFFFFF',
    'border-radius': '8px'
})
toast.show()
Spectrum Viewer
components/widgets/matplotlib_widget.py
Interactive spectrum visualization widget.
SpectrumViewer Class
from components.widgets.matplotlib_widget import SpectrumViewer

viewer = SpectrumViewer(parent)
Features:
Interactive plotting
Zoom/pan controls
Multiple spectra overlay
Baseline annotation
Peak markers
Export to image
Methods:
plot_spectrum(wavenumbers: np.ndarray, intensity: np.ndarray, label: str = None, **kwargs)
Plot single spectrum.
viewer.plot_spectrum(
    wavenumbers=np.array([400, 500, 600, ...]),
    intensity=np.array([0.1, 0.3, 0.5, ...]),
    label='Sample 1',
    color='blue',
    linewidth=1.5,
    alpha=0.8
)
Parameters:
wavenumbers(np.ndarray): X-axis values (cm⁻¹)intensity(np.ndarray): Y-axis valueslabel(str, optional): Legend label**kwargs: Matplotlib plot parameters
plot_spectra(data: dict, colors: List[str] = None)
Plot multiple spectra.
viewer.plot_spectra(
    data={
        'wavenumbers': np.array([...]),
        'spectra': np.array([[...], [...], ...]),
        'labels': ['Sample1', 'Sample2', 'Sample3']
    },
    colors=['blue', 'red', 'green']
)
Parameters:
data(dict): Data dictionary with wavenumbers/spectra/labelscolors(List[str], optional): Color for each spectrum
plot_mean_spectrum(data: dict, groups: List[str] = None, show_std: bool = True)
Plot mean spectrum with standard deviation.
viewer.plot_mean_spectrum(
    data=data,
    groups=['Control', 'Treatment'],
    show_std=True  # Show shaded std region
)
Parameters:
data(dict): Data dictionarygroups(List[str], optional): Groups to plotshow_std(bool): Show standard deviation
add_peak_markers(peaks: List[float], labels: List[str] = None)
Add vertical markers at peak positions.
viewer.add_peak_markers(
    peaks=[1004, 1445, 1660],
    labels=['Phe', 'CH₂', 'Amide I']
)
Parameters:
peaks(List[float]): Peak wavenumberslabels(List[str], optional): Peak labels
add_baseline(wavenumbers: np.ndarray, baseline: np.ndarray)
Overlay baseline curve.
viewer.add_baseline(
    wavenumbers=wn,
    baseline=calculated_baseline
)
Parameters:
wavenumbers(np.ndarray): X valuesbaseline(np.ndarray): Baseline Y values
clear_plot()
Clear all plotted data.
viewer.clear_plot()
set_xlim(xmin: float, xmax: float)
Set X-axis limits.
viewer.set_xlim(400, 1800) # Focus on fingerprint region
Parameters:
xmin(float): Minimum wavenumberxmax(float): Maximum wavenumber
set_labels(xlabel: str, ylabel: str, title: str = None)
Set axis labels and title.
viewer.set_labels(
    xlabel='Wavenumber (cm⁻¹)',
    ylabel='Intensity (a.u.)',
    title='Preprocessed Spectra'
)
Parameters:
xlabel(str): X-axis labelylabel(str): Y-axis labeltitle(str, optional): Plot title
export_figure(filepath: str, dpi: int = 300)
Export plot to image file.
viewer.export_figure(
    'results/spectrum.png',
    dpi=300
)
Parameters:
filepath(str): Output file pathdpi(int): Resolution
Supported Formats: PNG, PDF, SVG, JPG
Data Table
components/widgets/views_widget.py
Tabular data display with sorting and filtering.
DataTable Class
from components.widgets.views_widget import DataTable

table = DataTable(parent)
Features:
Sortable columns
Row filtering
Cell editing
Export to CSV/Excel
Custom cell renderers
Methods:
set_data(data: pd.DataFrame)
Load data into table.
import pandas as pd

df = pd.DataFrame({
    'Sample': ['S1', 'S2', 'S3'],
    'Group': ['Control', 'Control', 'Treatment'],
    'Intensity': [0.85, 0.92, 0.78]
})

table.set_data(df)
Parameters:
data(pd.DataFrame): Data to display
get_data() -> pd.DataFrame
Get current table data.
df = table.get_data()
Returns: pd.DataFrame - Current data
get_selected_rows() -> List[int]
Get selected row indices.
selected = table.get_selected_rows()
print(f"Selected rows: {selected}")
Returns: List[int] - Row indices
filter_rows(column: str, value: Any)
Filter table by column value.
# Show only Control group
table.filter_rows('Group', 'Control')

# Show high intensity samples
table.filter_rows('Intensity', lambda x: x > 0.8)
Parameters:
column(str): Column namevalue(Any or callable): Filter value or function
sort_by_column(column: str, ascending: bool = True)
Sort table by column.
table.sort_by_column('Intensity', ascending=False)
Parameters:
column(str): Column nameascending(bool): Sort order
export_data(filepath: str, format: str = 'csv')
Export table data.
table.export_data('results/data.csv', format='csv')
table.export_data('results/data.xlsx', format='excel')
Parameters:
filepath(str): Output file pathformat(str): Format (‘csv’, ‘excel’)
Parameter Panel
components/widgets/parameter_widgets.py
Dynamic parameter input widgets for preprocessing/analysis methods.
ParameterPanel Class
from components.widgets.parameter_widgets import ParameterPanel

panel = ParameterPanel(parent)
Features:
Auto-generate inputs from parameter specs
Parameter validation
Constrained inputs (min/max)
Tooltips with descriptions
Reset to defaults
Methods:
set_parameters(params: dict)
Configure parameter inputs.
panel.set_parameters({
    'lambda': {
        'type': 'float',
        'default': 1e5,
        'min': 1e2,
        'max': 1e9,
        'label': 'Lambda (λ)',
        'tooltip': 'Smoothness parameter'
    },
    'p': {
        'type': 'float',
        'default': 0.01,
        'min': 0.001,
        'max': 0.1,
        'label': 'Asymmetry (p)',
        'tooltip': 'Asymmetry parameter'
    },
    'method': {
        'type': 'choice',
        'default': 'asls',
        'choices': ['asls', 'airpls', 'polynomial'],
        'label': 'Method',
        'tooltip': 'Baseline correction method'
    }
})
Parameter Spec Fields:
type: ‘int’, ‘float’, ‘bool’, ‘str’, ‘choice’default: Default valuemin,max: Value constraints (numeric types)choices: Options list (choice type)label: Display labeltooltip: Help text
get_values() -> dict
Get current parameter values.
params = panel.get_values()
# Returns: {'lambda': 100000.0, 'p': 0.01, 'method': 'asls'}
Returns: dict - Parameter values
set_values(values: dict)
Set parameter values programmatically.
panel.set_values({
    'lambda': 1e6,
    'p': 0.005
})
Parameters:
values(dict): Parameter values
reset_to_defaults()
Reset all parameters to default values.
panel.reset_to_defaults()
validate() -> Tuple[bool, List[str]]
Validate current values.
is_valid, errors = panel.validate()

if not is_valid:
    for error in errors:
        print(f"Validation error: {error}")
Returns: Tuple[bool, List[str]] - (is_valid, error_messages)
Signals:
# Emitted when any parameter changes
panel.value_changed.connect(lambda param, value:
    print(f"{param} changed to {value}")
)
Pipeline Builder
components/widgets/component_selector_panel.py
Visual pipeline construction interface.
PipelineBuilder Class
from components.widgets.component_selector_panel import PipelineBuilder

builder = PipelineBuilder(parent)
Features:
Drag-and-drop method ordering
Visual step cards
Parameter editing per step
Step enable/disable
Pipeline templates
UI Layout:
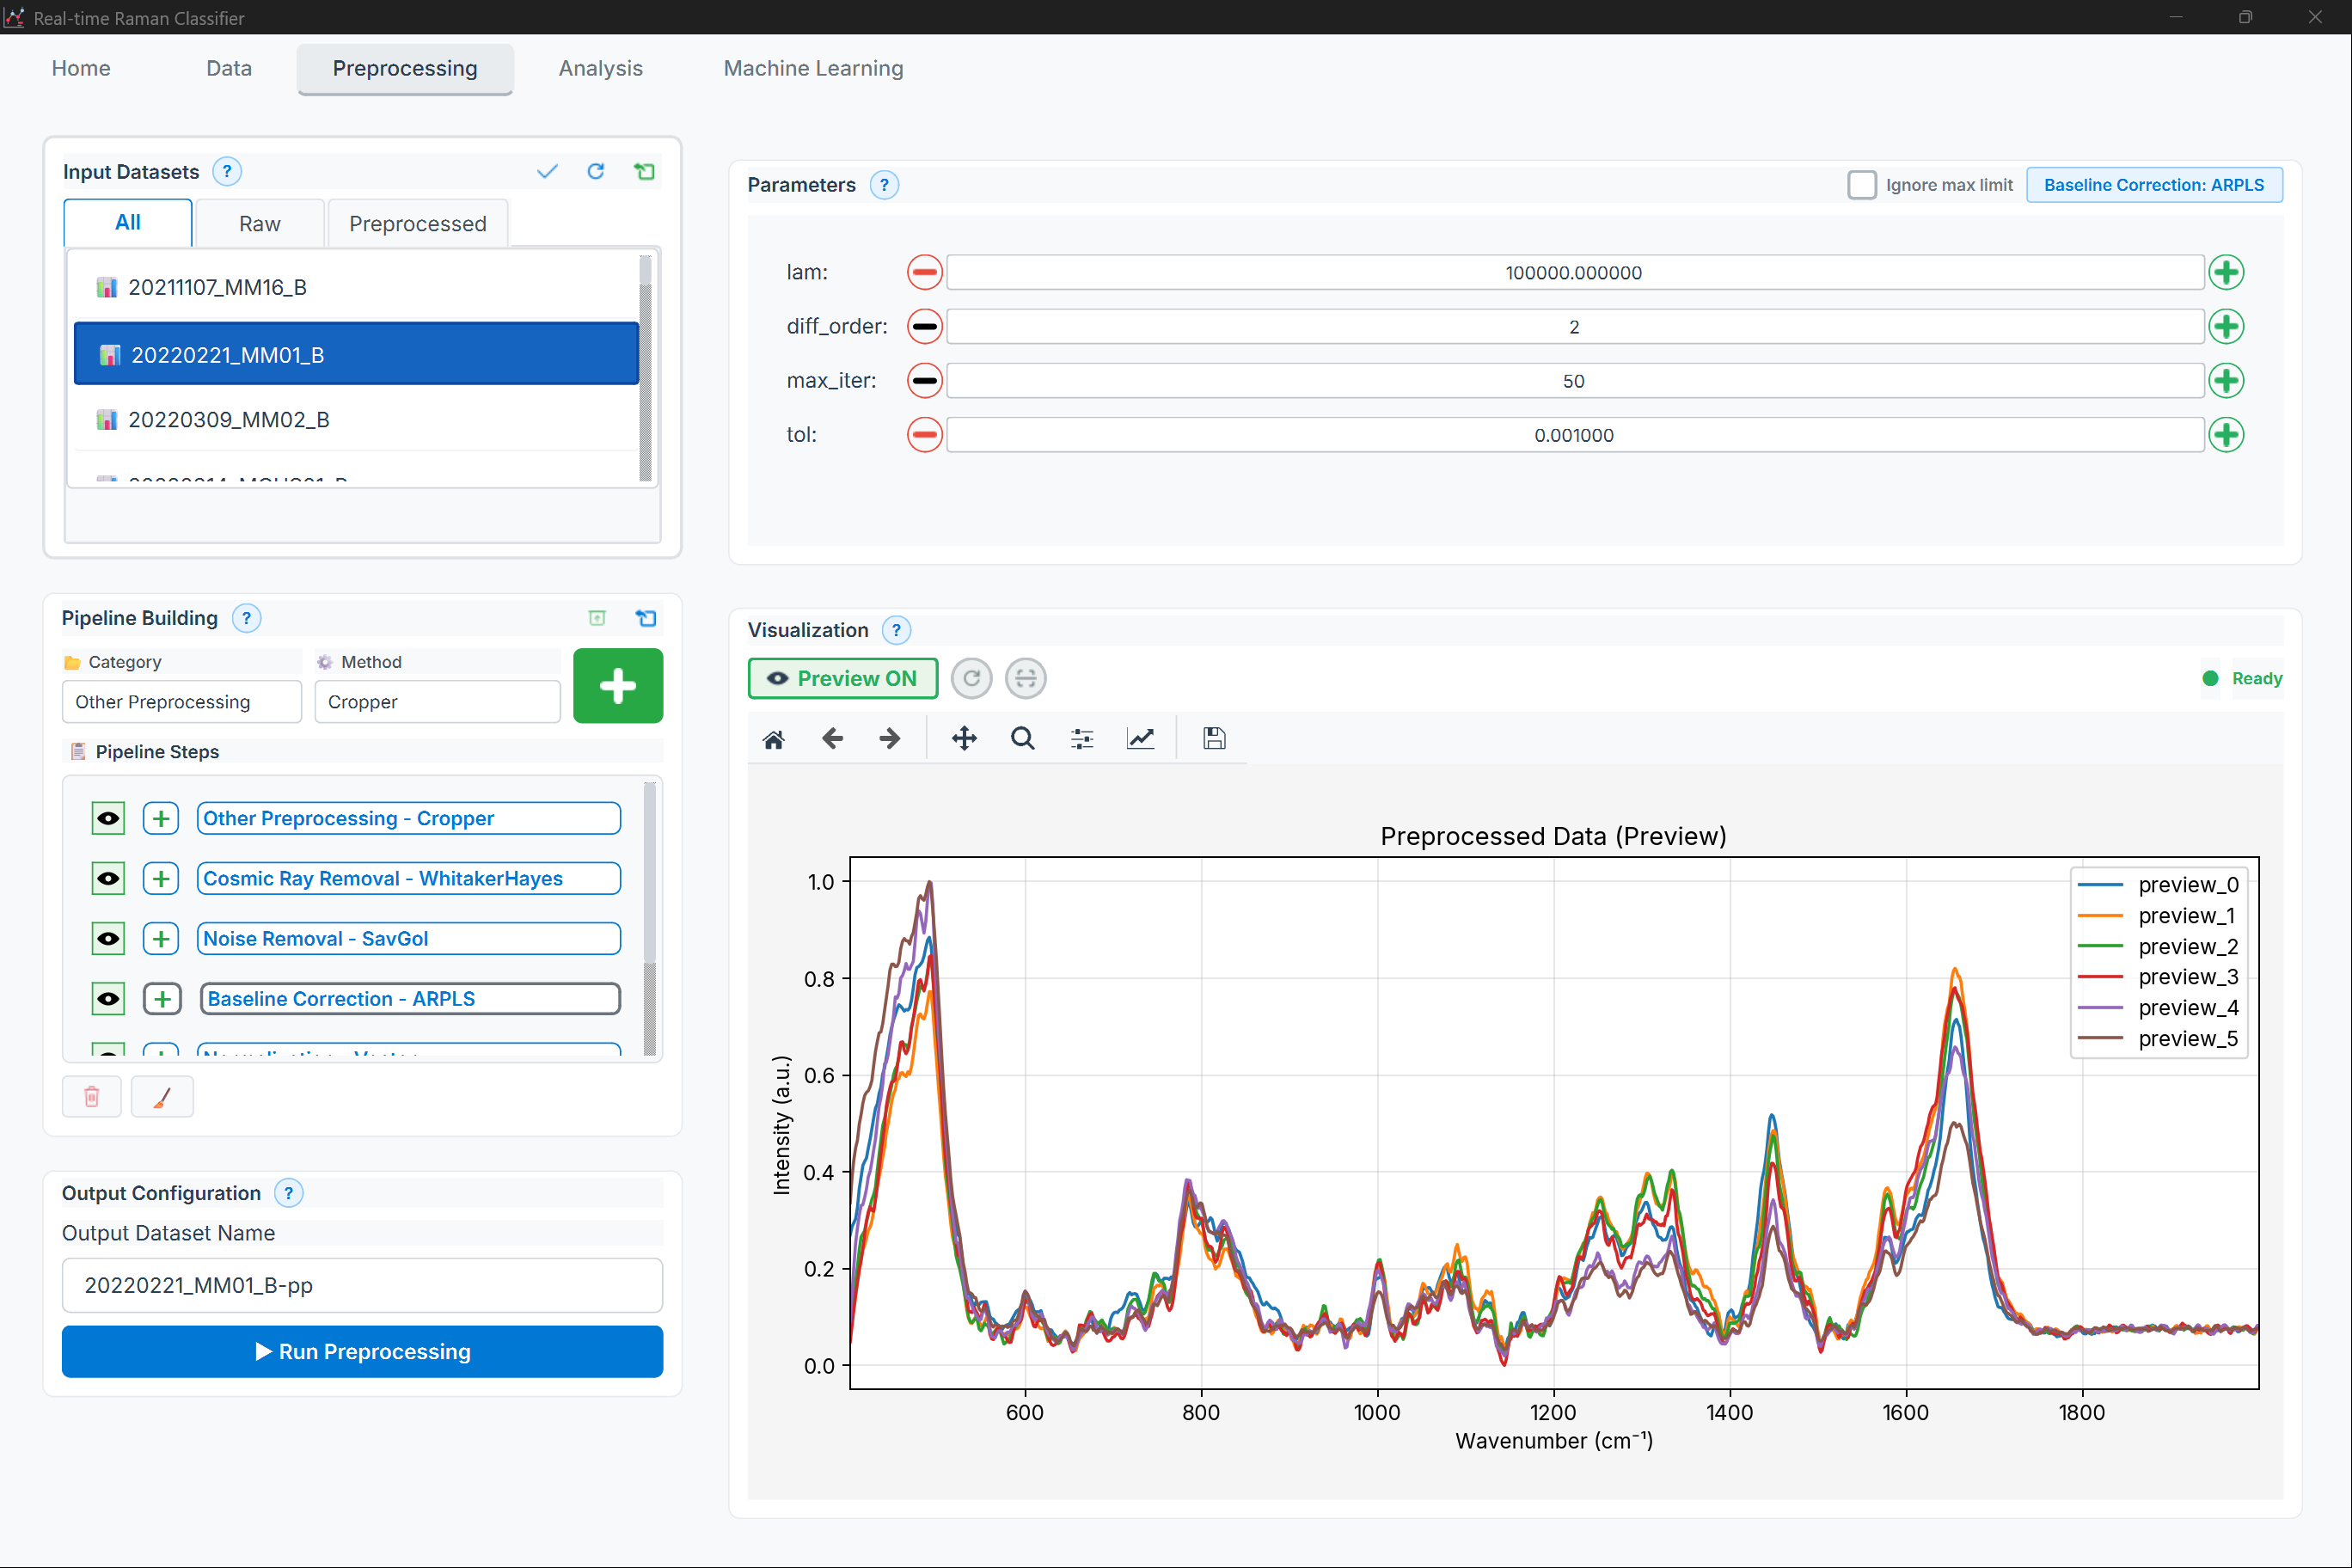
Figure: Preprocessing page showing the pipeline builder (available methods + pipeline steps)
High-level layout:
Available methods (by category)
Pipeline steps list (enable/disable, reorder, edit parameters)
Add step actions
Methods:
add_method(method_name: str, params: dict = None) -> int
Add method to pipeline.
step_id = builder.add_method(
    'asls',
    params={'lambda': 1e5, 'p': 0.01}
)
Parameters:
method_name(str): Method identifierparams(dict, optional): Method parameters
Returns: int - Step ID
remove_step(step_id: int)
Remove step from pipeline.
builder.remove_step(step_id)
Parameters:
step_id(int): Step identifier
move_step(step_id: int, direction: str)
Move step up or down.
builder.move_step(step_id, 'up')
builder.move_step(step_id, 'down')
Parameters:
step_id(int): Step identifierdirection(str): ‘up’ or ‘down’
toggle_step(step_id: int, enabled: bool)
Enable or disable step.
# Disable baseline correction temporarily
builder.toggle_step(step_id, enabled=False)
Parameters:
step_id(int): Step identifierenabled(bool): Enable state
get_pipeline() -> List[dict]
Get pipeline configuration.
pipeline = builder.get_pipeline()

# Returns:
# [
#     {'method': 'asls', 'params': {'lambda': 1e5, 'p': 0.01}, 'enabled': True},
#     {'method': 'savgol', 'params': {'window_length': 11, 'polyorder': 3}, 'enabled': True},
#     {'method': 'vector_norm', 'params': {}, 'enabled': True}
# ]
Returns: List[dict] - Pipeline steps
load_pipeline(pipeline: List[dict])
Load pipeline configuration.
builder.load_pipeline([
    {'method': 'asls', 'params': {'lambda': 1e5, 'p': 0.01}},
    {'method': 'savgol', 'params': {'window_length': 11, 'polyorder': 3}}
])
Parameters:
pipeline(List[dict]): Pipeline configuration
clear_pipeline()
Remove all steps.
builder.clear_pipeline()
Signals:
# Emitted when pipeline changes
builder.pipeline_changed.connect(lambda: update_preview())

# Emitted when step is edited
builder.step_edited.connect(lambda step_id: validate_step(step_id))
Results Panel
components/widgets/results_panel.py
Display analysis and model results.
ResultsPanel Class
from components.widgets.results_panel import ResultsPanel

results = ResultsPanel(parent)
Features:
Tabbed result views
Confusion matrix display
Metrics table
ROC curve plotting
Export results
Methods:
set_classification_results(results: dict)
Display classification results.
results.set_classification_results({
    'confusion_matrix': np.array([[45, 5], [3, 47]]),
    'accuracy': 0.92,
    'precision': 0.90,
    'recall': 0.94,
    'f1_score': 0.92,
    'roc_auc': 0.96,
    'classes': ['Control', 'Treatment']
})
Parameters:
results(dict): Classification metrics
Displays:
Confusion matrix heatmap
Metrics table
ROC curve
set_pca_results(results: dict)
Display PCA results.
results.set_pca_results({
    'scores': scores_array,
    'loadings': loadings_array,
    'explained_variance_ratio': np.array([0.45, 0.32, 0.15]),
    'groups': groups_list
})
Parameters:
results(dict): PCA results
Displays:
Scores plot
Scree plot
Loadings plot
set_clustering_results(results: dict)
Display clustering results.
results.set_clustering_results({
    'clusters': cluster_labels,
    'method': 'kmeans',
    'n_clusters': 3,
    'silhouette_score': 0.68,
    'scatter_data': scatter_coords
})
Parameters:
results(dict): Clustering results
Displays:
Cluster scatter plot
Silhouette plot
Metrics table
add_plot(name: str, figure: Figure)
Add custom matplotlib figure.
import matplotlib.pyplot as plt

fig, ax = plt.subplots()
ax.plot([1, 2, 3], [4, 5, 6])

results.add_plot('Custom Plot', fig)
Parameters:
name(str): Plot name (tab label)figure(matplotlib.figure.Figure): Figure object
export_results(filepath: str, format: str = 'xlsx')
Export all results.
results.export_results('results/analysis.xlsx', format='xlsx')
results.export_results('results/report.pdf', format='pdf')
Parameters:
filepath(str): Output file pathformat(str): Format (‘xlsx’, ‘csv’, ‘pdf’, ‘html’)
Multi-Group Dialog
components/widgets/multi_group_dialog.py
Dialog for multi-group statistical comparisons.
MultiGroupDialog Class
from components.widgets.multi_group_dialog import MultiGroupDialog

dialog = MultiGroupDialog(
    groups=['Control', 'Treatment_A', 'Treatment_B'],
    parent=self
)

if dialog.exec() == QDialog.Accepted:
    config = dialog.get_configuration()
Features:
Group selection
Test method selection
Post-hoc options
Multiple testing correction
Methods:
get_configuration() -> dict
Get analysis configuration.
config = dialog.get_configuration()

# Returns:
# {
#     'groups': ['Control', 'Treatment_A', 'Treatment_B'],
#     'test_method': 'anova',
#     'post_hoc': 'tukey',
#     'correction_method': 'fdr_bh',
#     'alpha': 0.05
# }
Returns: dict - Analysis configuration
set_available_methods(methods: List[str])
Set available test methods.
dialog.set_available_methods([
    'anova',
    'kruskal',
    'friedman'
])
Parameters:
methods(List[str]): Available test methods
External Evaluation Dialog
components/widgets/external_evaluation_dialog.py
Dialog for evaluating model on external dataset.
ExternalEvaluationDialog Class
from components.widgets.external_evaluation_dialog import ExternalEvaluationDialog

dialog = ExternalEvaluationDialog(
    model=trained_model,
    parent=self
)

if dialog.exec() == QDialog.Accepted:
    results = dialog.get_results()
Features:
Load external data
Apply same preprocessing
Evaluate predictions
Generate report
Methods:
load_external_data(filepath: str)
Load external dataset.
dialog.load_external_data('validation_data.csv')
Parameters:
filepath(str): External data file
set_preprocessing_pipeline(pipeline: List[dict])
Set preprocessing pipeline to apply.
dialog.set_preprocessing_pipeline([
    {'method': 'asls', 'params': {'lambda': 1e5, 'p': 0.01}},
    {'method': 'vector_norm', 'params': {}}
])
Parameters:
pipeline(List[dict]): Preprocessing steps
get_results() -> dict
Get evaluation results.
results = dialog.get_results()

# Returns:
# {
#     'predictions': np.array([...]),
#     'accuracy': 0.88,
#     'confusion_matrix': np.array([[...], ...]),
#     'classification_report': {...}
# }
Returns: dict - Evaluation results
Component Communication
Signal-Slot Patterns
# Page to Page communication
class PreprocessPage(BasePage):
    data_processed = pyqtSignal(dict)  # Emit processed data

    def on_apply_clicked(self):
        result = self.apply_pipeline()
        self.data_processed.emit(result)

class AnalysisPage(BasePage):
    def __init__(self):
        super().__init__()
        # Connect to preprocessing signal
        preprocess_page.data_processed.connect(self.load_data)
Event Bus Pattern
from components.event_bus import EventBus

# Publisher
EventBus.publish('data_loaded', {'samples': 100})

# Subscriber
EventBus.subscribe('data_loaded', self.on_data_loaded)

def on_data_loaded(self, data):
    print(f"Loaded {data['samples']} samples")
Best Practices
Component Reusability
# Good: Reusable component
class SpectrumPlot(QWidget):
    def __init__(self, parent=None):
        super().__init__(parent)
        self.setup_ui()

    def plot_data(self, x, y):
        # Generic plotting logic
        pass

# Use in multiple pages
home_plot = SpectrumPlot()
preprocess_plot = SpectrumPlot()
State Management
class StatefulComponent(QWidget):
    def save_state(self) -> dict:
        """Save component state"""
        return {
            'selected_items': self.get_selected_items(),
            'view_settings': self.get_view_settings()
        }

    def restore_state(self, state: dict):
        """Restore component state"""
        self.set_selected_items(state['selected_items'])
        self.apply_view_settings(state['view_settings'])
Error Handling in Components
class RobustComponent(QWidget):
    error_occurred = pyqtSignal(str)

    def perform_action(self):
        try:
            # Component logic
            self.do_something()
        except Exception as e:
            self.error_occurred.emit(str(e))
            logger.exception("Component error")
See Also
Core API - Core application modules
Pages API - Application pages
Functions API - Processing functions
Widgets API - Custom widgets
Last Updated: 2026-01-24